
Quantify Your Fuel Cost Variance & Evaluate Liquidity
Access two interactive tools built on independent OPIS rack intelligence to model potential annualized savings and assess physical terminal depth across your operational footprint.
In physical wholesale fuel markets, managing procurement margins and contract risk requires visibility into two core dynamics: understanding how daily rack price variance impacts your bottom line, and evaluating market liquidity to support competitive pricing.
Access two interactive analytical tools developed to help bring transparency to the fuel supply chain.
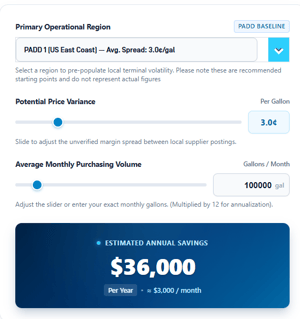
Estimate Annualized Savings: Use our analytical model to quantify your internal price variance and calculate what tightening contract formulas against independent benchmarks could save your business over a 12-month period.
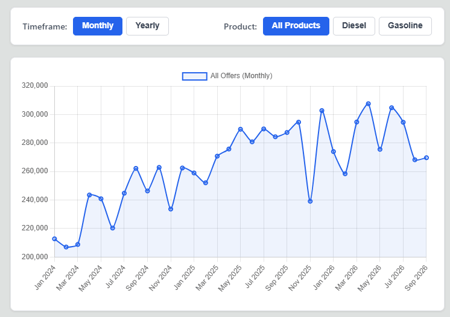
Terminal Supply Liquidity Trend: Explore our interactive Bottom-Line Offer Counts tool, visualizing the number of observed offers posted below the OPIS Low since 2023. See how many observed offers we recorded and learn what this could mean for the market.
Submit the form to access the tools.