Quickly separate the winning and losing markets to make better investment decisions.
Discover what markets are most profitable, what brands have the best pricing power and more.
Examine last year’s volatile market by looking at precise measurements that put 2017 fluctuations into perspective.
Benchmark profit margins and retail fuel prices by brand and region against competitors.
Track the profitability of the major players in this rapidly changing market.
Read expert commentary from OPIS editors as they take a look at how the market moved last year and what’s in store for 2018.
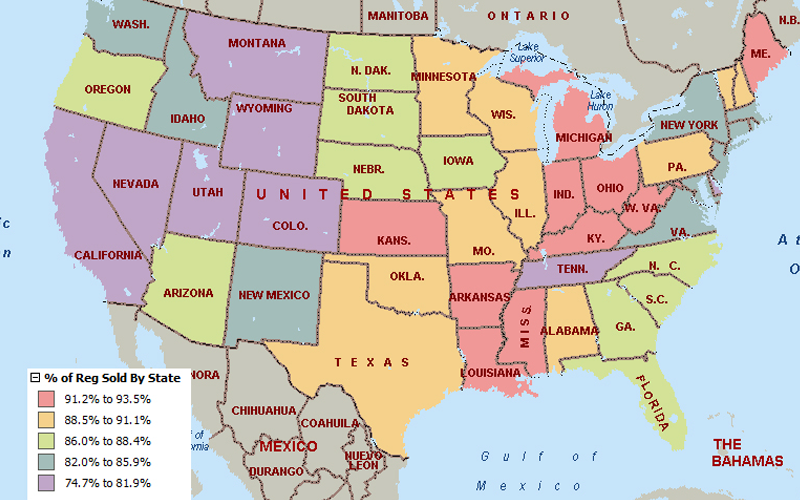
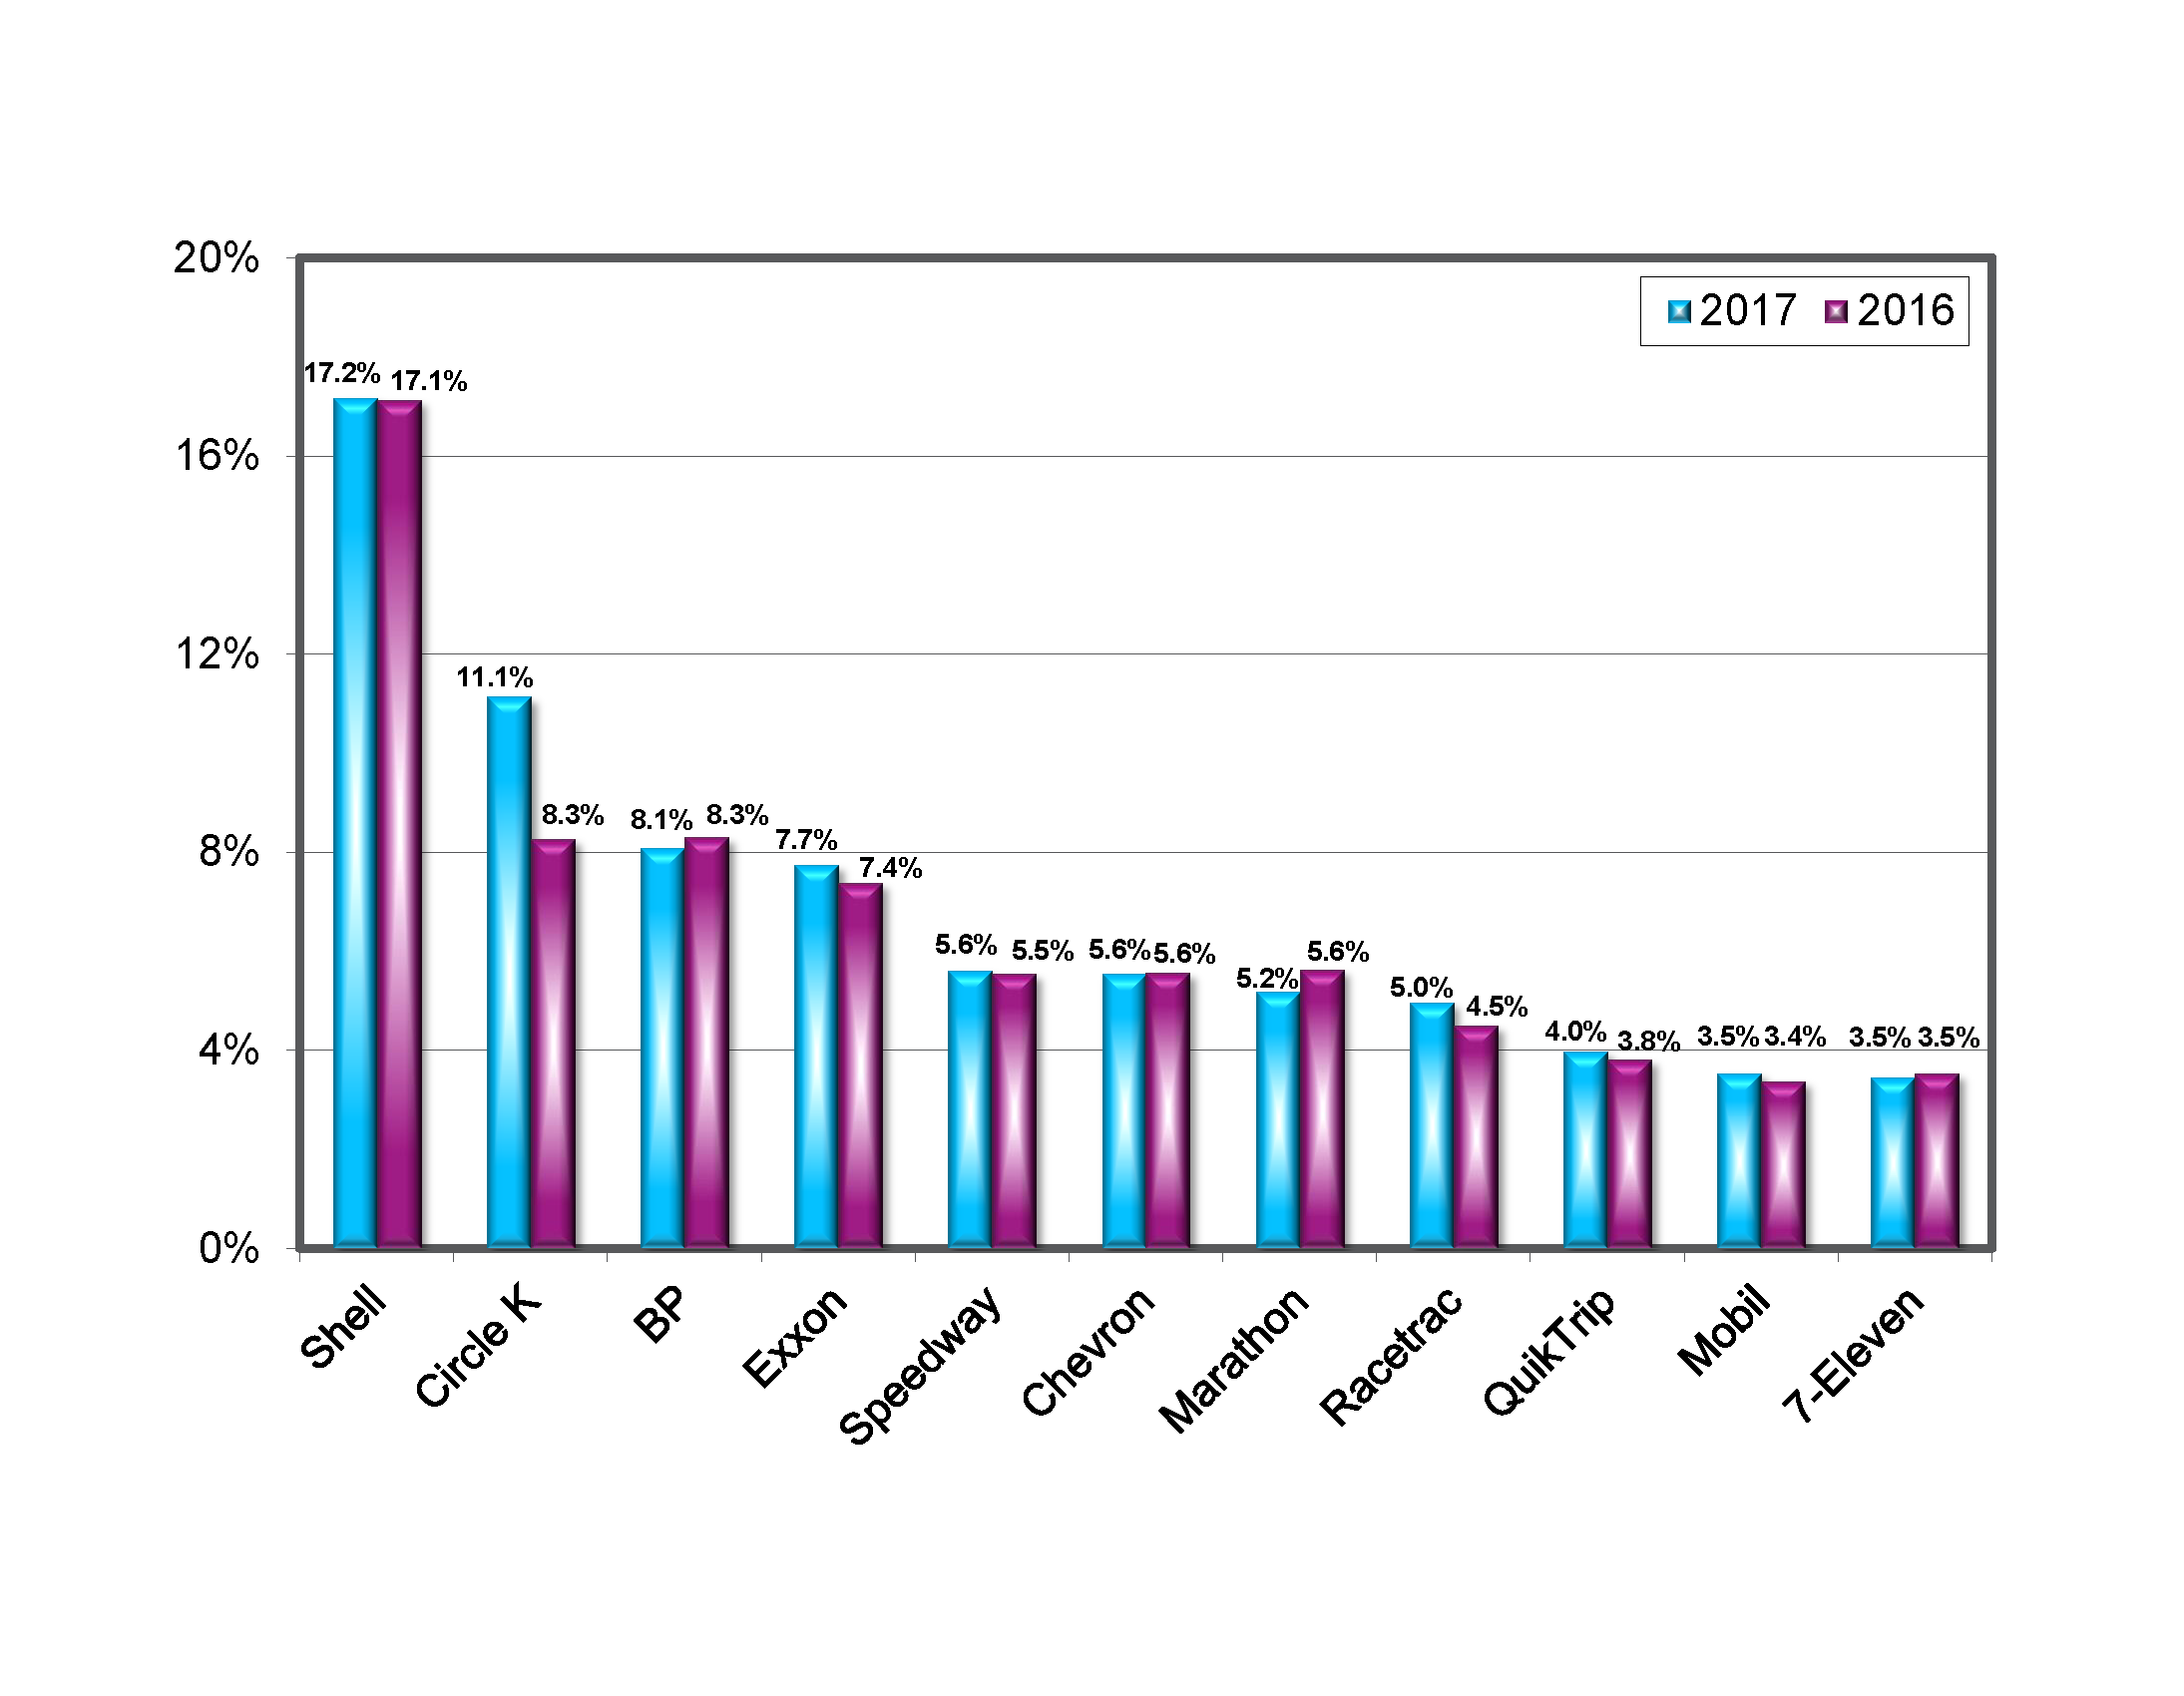
Compares the past two years’ market share estimates by brand on a national and regional basis.
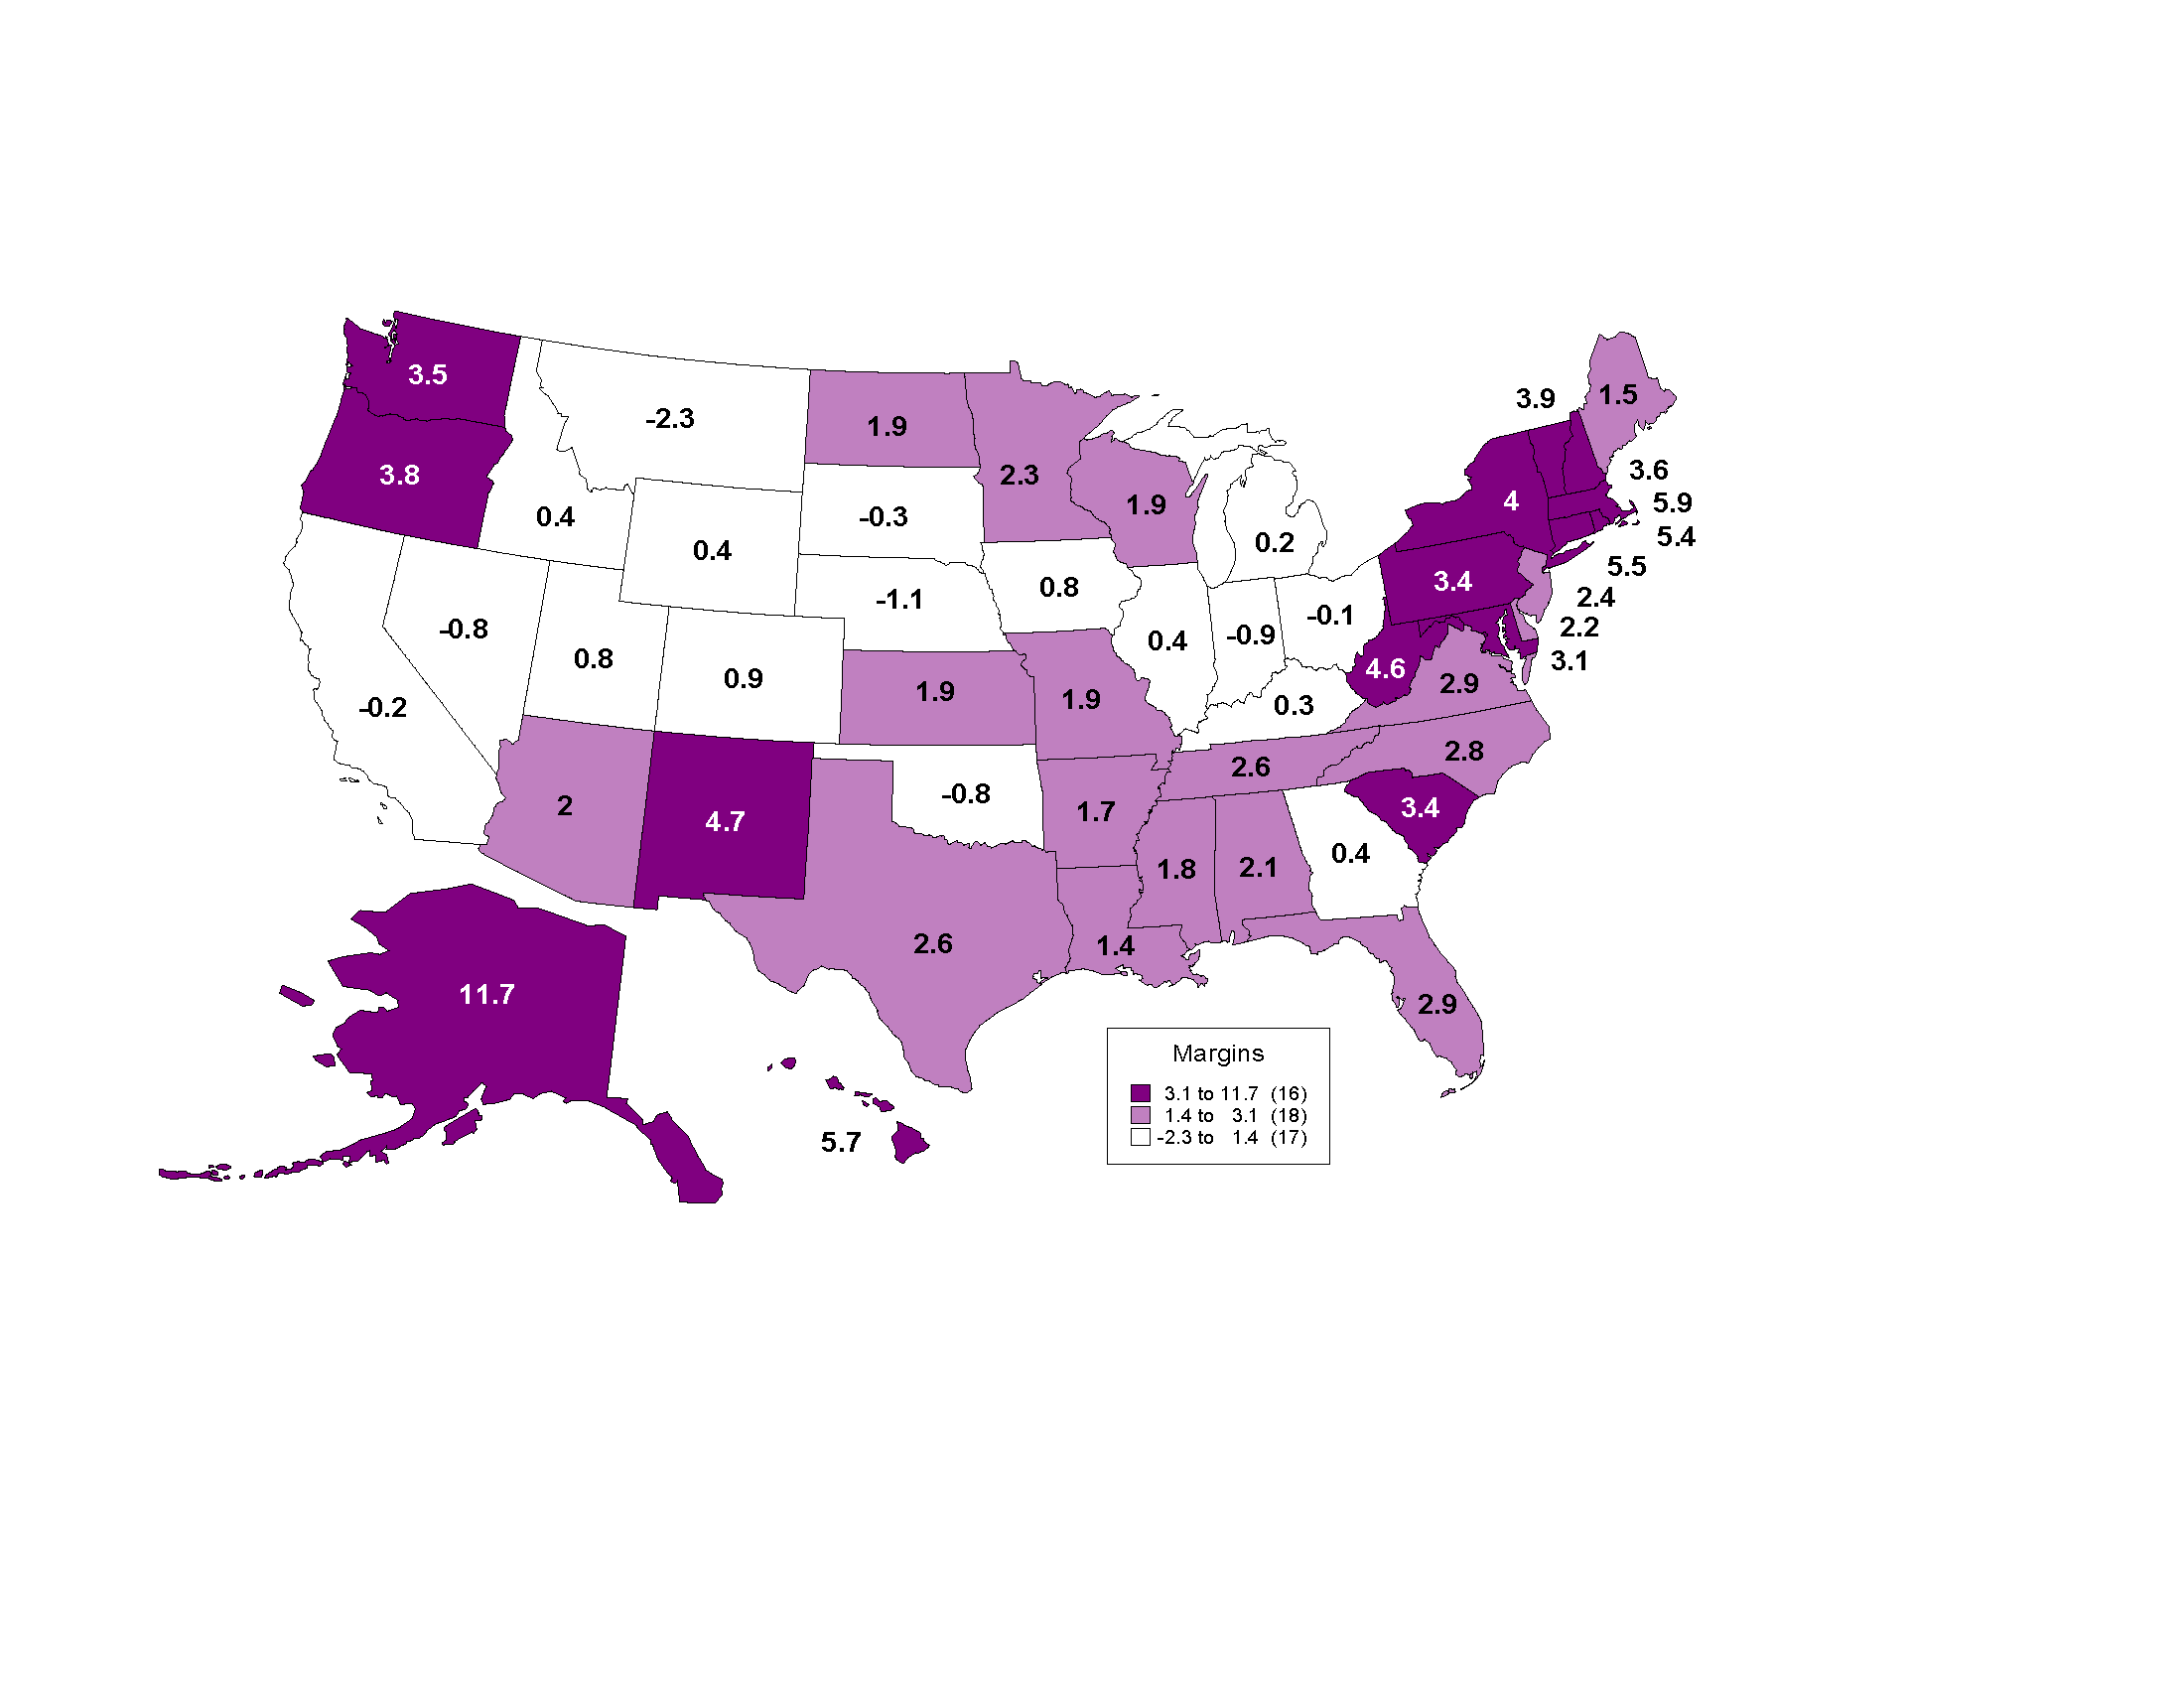
Provides rankings for the top 50 highest and lowest rack-to-retail gasoline margin markets in the U.S. – including margin changes from the previous year.
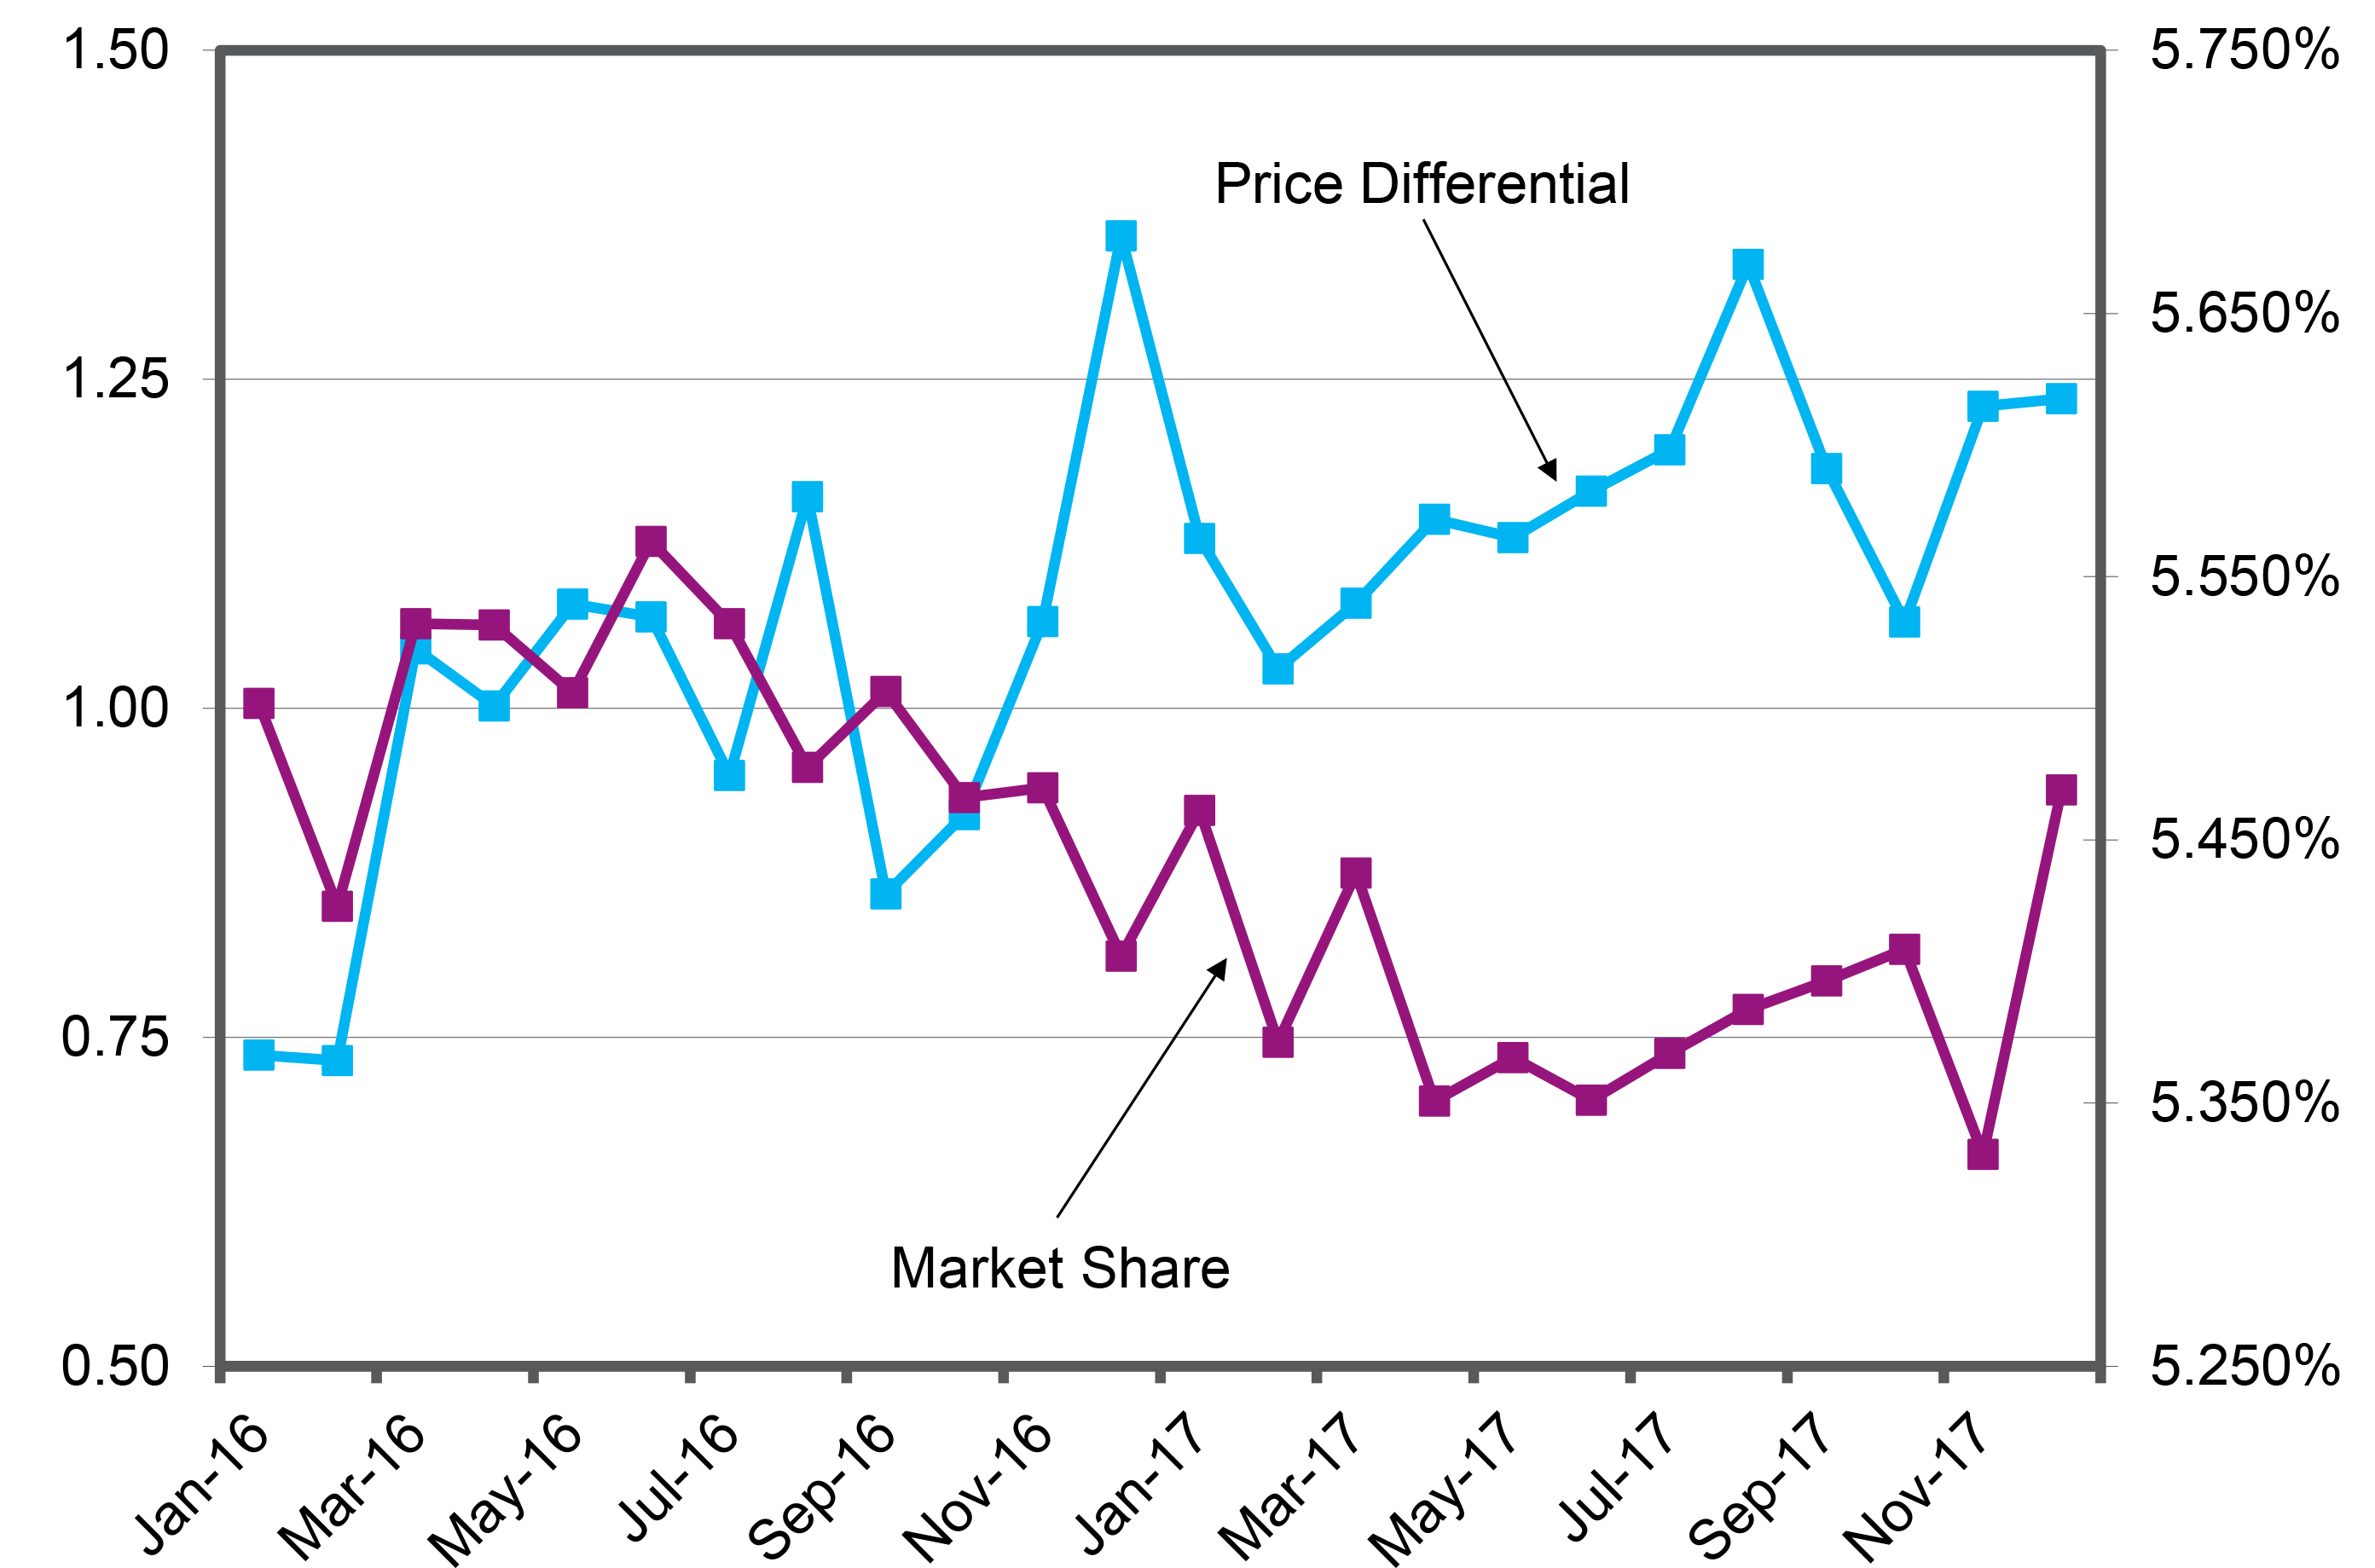
Provides a collection of charts that show how aggressive chains and traditional brands were priced (cts/gal) relative to their direct competitors.
Shows at-a-glance what years yielded the highest gross profits from 1998-2017 as an aggregate and percentage of revenue.
Exposes the best and worst performing regions in the U.S. using color-coded maps.
Ranks 100 brands from 2016 to 2017.
Compares average yearly changes in retail and wholesale rack prices from 2001-2017.
Reveals gross rack-to-retail margins for 2015- 2017 and proves not all markets are created equal.
Compares seasonal rack-to-retail margins for 2014-2017.
Reveals regional rack-to-retail margin trends on an annual basis for 2014-2017.
Provides seasonal rack average price swings for 2017 by region. Data is segmented by winter, spring, summer and fall rallies.
Examines each region in detail. Get a close look at the best and worst performing regions.
Provides charts and graphs for rack-to-retail diesel margins on an annual and weekly basis, plus, shows national rack-to-retail diesel margins by state.
Presents statisitics from the Department of Energy.
Provides charts on the daily and annual highs and lows on the NYMEX from 2002-2017.
Compares the heat crack, unleaded crack and RBOB crack in terms of dollar/bbl from 2002-2017.


