
Beyond the Rack Benchmarks: See the Full Story in Wholesale Fuel Pricing
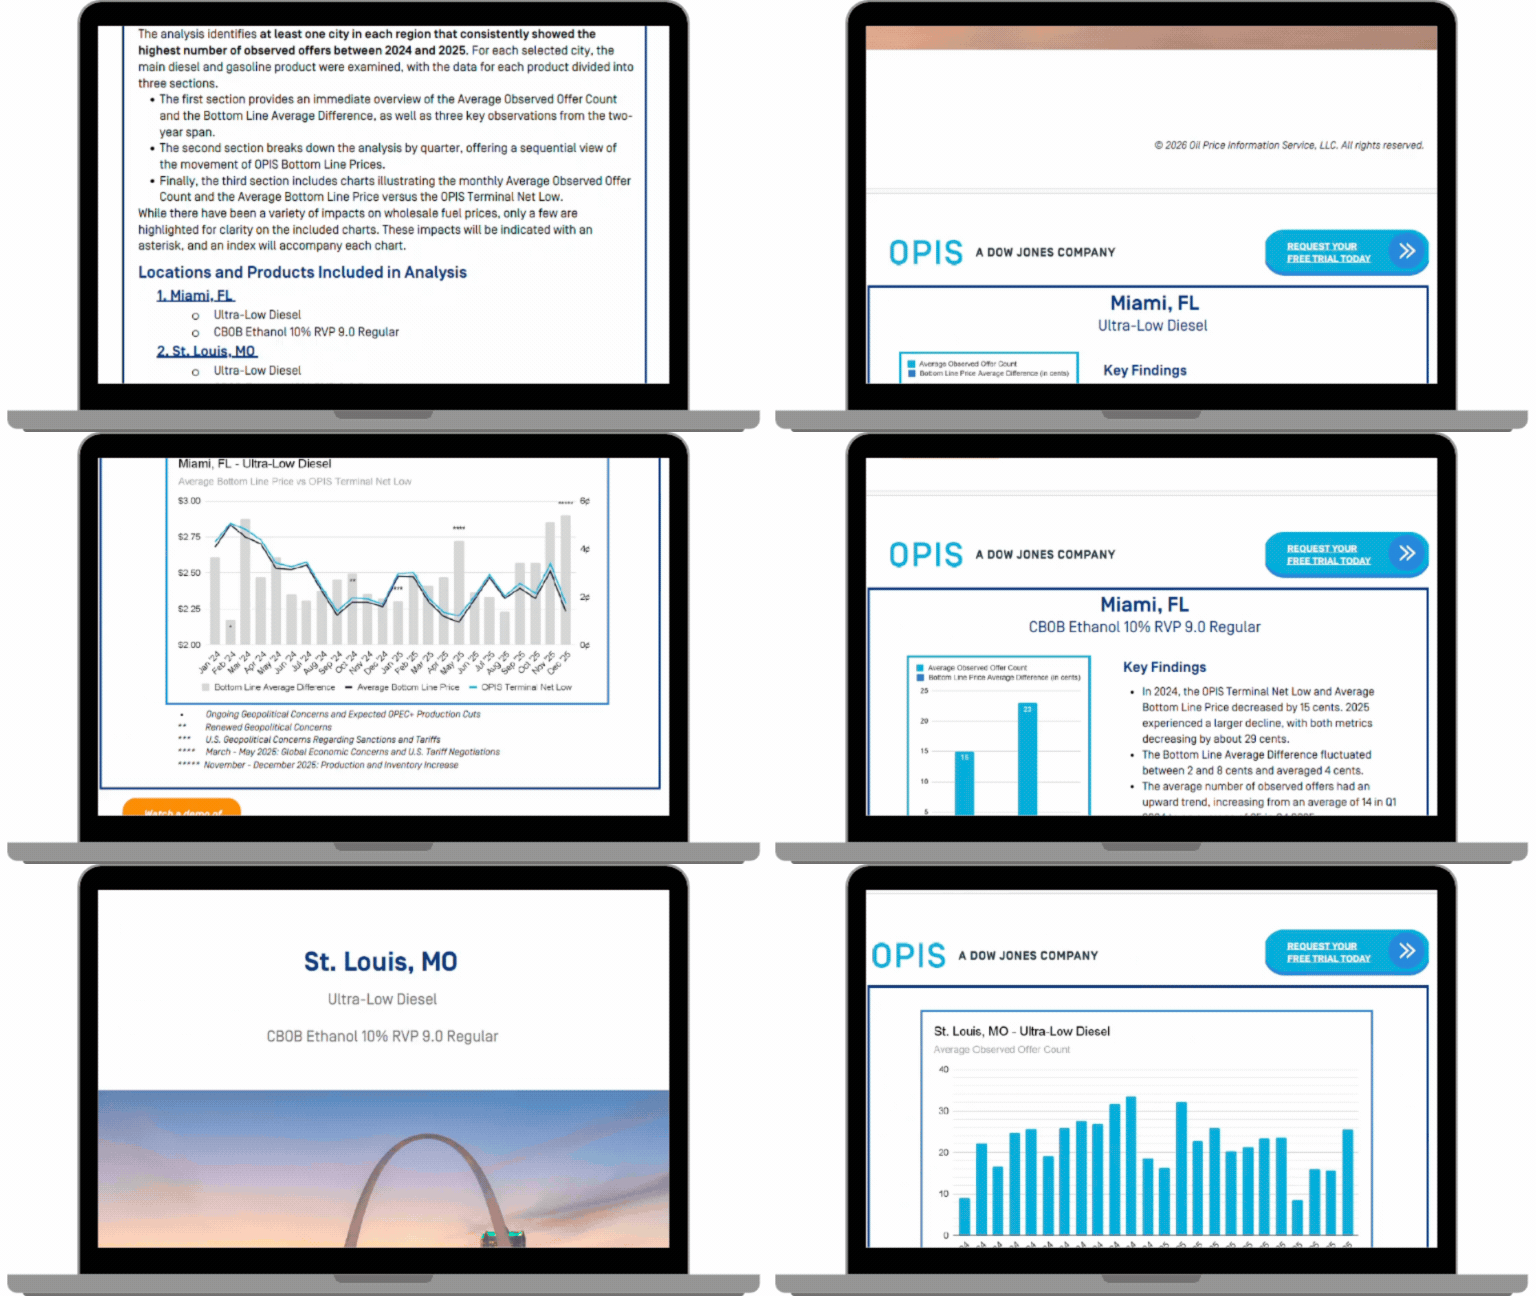
Free Whitepaper: Beyond the Rack Benchmarks – OPIS Bottom Line Fuel Market Trends 2024–2025
In this whitepaper, OPIS Principal Research Analyst Lauren Lucernoni unpacks two years of below‑rack wholesale fuel observed offers — prices that sit under OPIS Terminal Net Low and often never surface in standard rack reports — to reveal how contracts, incentives, and competitive pressures are shaping real‑world deal levels across key U.S. markets.
Why is this data relevant (even though it’s 2024–2025)?
This whitepaper uses January 2024–December 2025 as a live stress test of how wholesale fuel behaves through full market cycles, shocks and reversals.
Rather than fixating on absolute prices, it focuses on relationships — how often deals clear below the rack, how wide discounts get and how quickly they compress. Those structural patterns in below-rack behavior are exactly the signals you can still use today to understand the market.
What’s inside?
Over 2024–2025, OPIS tracked observed offers below the OPIS low for diesel and gasoline in six representative markets — including Miami, Denver, Houston, St. Louis, Albuquerque and Stockton — and compared them to OPIS Terminal Net Low. In this analysis, you’ll get:
-
Quarter‑by‑quarter pricing narratives that explain how OPIS Bottom Line Prices moved versus OPIS Terminal Net Low in each city.
-
Observed offer counts and discounts that show how often below‑rack activity appeared and how deep discounts ran in both diesel and gasoline.
-
Charts of monthly trends so you can see at a glance when competition intensified, when markets tightened, and how quickly conditions shifted.
-
Context on how geopolitical events, OPEC+ decisions and macroeconomic concerns translated into competitive pressure at the terminal level.
Who should read this?
This analysis is designed for decision‑makers across the refined products value chain:
-
Traders & fleets looking to interpret rack movements more accurately and read underlying market softness or tightness.
-
Retailers & marketers who need to understand how their discretionary discounts, formulas and incentives compare to broader market behavior.
-
Wholesalers & jobbers who rely on executable pricing to make sourcing decisions, negotiate contracts and manage net margins.
-
Suppliers, municipalities and financial institutions that require more than posted racks to explain margins, competitive dynamics and regional market health.
You can learn more about the Bottom Line Report and request your FREE Trial to access this data for your region.